Install the extension
Or in VS Code, press Cmd+Shift+X on Mac or Ctrl+Shift+X on Windows and Linux to open the Extensions view, search for “Embedder”, and click Install.Get started
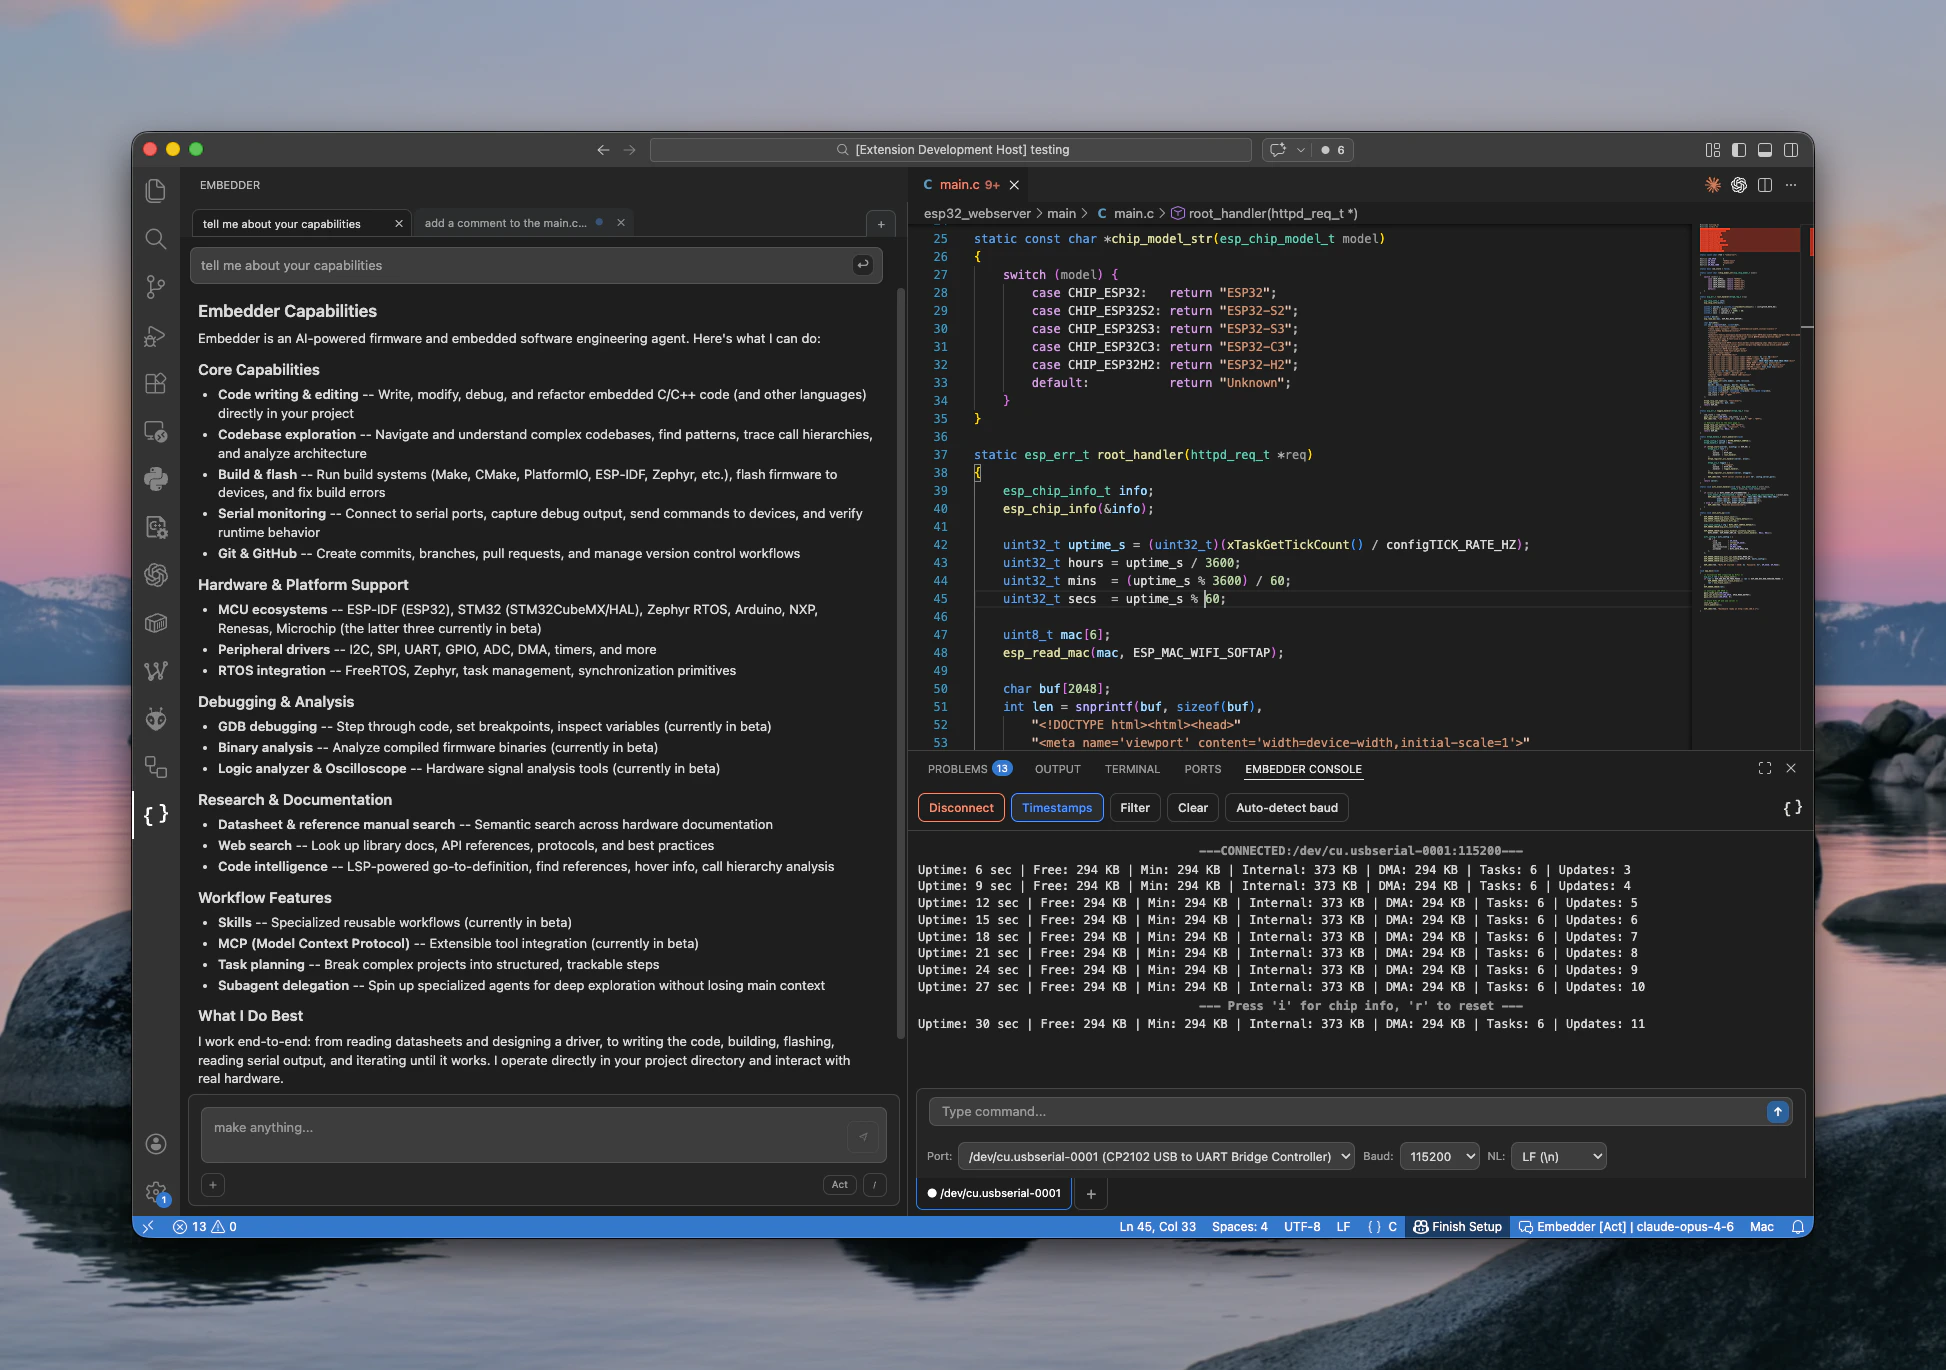
Once installed, you can use Embedder natively in your IDE.Open the Embedder panel
The quickest way to open Embedder is to click the icon from the Activity Bar on the left side of your screen.Another way to open Embedder is through the Command Palette. Use Cmd+Shift+P (Mac) or Ctrl+Shift+P (Windows/Linux), type “Embedder”, and select “New Chat Tab”.
Send a prompt
Ask Embedder to help with your code or files, whether that’s explaining how something works, debugging an issue, or making changes. See common workflows for more examples of things you can do with Embedder.
Configure project
- Choose an existing project or create a new one
- Select the platform you’re using from our catalog, or add your own
- Select the peripherals you’re using from our catalog, or add your own
- Generate
EMBEDDER.mdwith/init
VS Code commands and shortcuts
Open the Command Palette (Cmd+Shift+P on Mac or Ctrl+Shift+P on Windows/Linux) and type “Embedder” to see all available VS Code commands for the Embedder extension.These are VS Code commands for controlling the extension. Not all built-in Embedder commands are available in the extension.
| Command | Description |
|---|---|
| Open Embedder Chat | Opens the Embedder chat panel |
| Switch Mode (Act/Plan) | Toggle between Act and Plan modes |
| New Chat Tab | Creates a new chat tab |
| Close Active Chat Tab | Closes the current chat tab |
| Restart CLI Server | Restarts the CLI backend process |
| Switch Model | Change the AI model |
| Stop Generation | Stop the current AI response |
| Install Embedder CLI | Install the CLI binary |
| Clear Conversation | Clear chat history |
| Compress Conversation | Compress conversation to save tokens |
| View Usage & Billing | View usage statistics |
| View Conversation History | Browse past conversations |
| Switch Team | Change active team |
| Switch Project | Change active project |
| Undo Last Message | Undo the last message |
| Open Web Console | Open web console |
| Open CLI Logs | View CLI log files |
| Show CLI Process Output | Show CLI process stdout |
| Open Embedder Console (Panel) | Open serial console in panel |
| Open Embedder Console in Editor | Open serial console as editor tab |
| Toggle Embedder Console | Toggle serial console visibility |
Rewind with checkpoints
The VS Code extension supports checkpoints, which track Embedder’s file edits and let you rewind to a previous state. Click the rewind button on any message, or use the/undo or /rewind commands, to choose from three options:
- Fork conversation from here — Start a new conversation branch from this message while keeping all code changes intact.
- Rewind code to here — Revert file changes back to this point in the conversation while keeping the full conversation history.
- Fork conversation and rewind code — Start a new conversation branch and revert file changes to this point.
Serial console
Embedder can interact with your serial console directly. It can read serial output history to diagnose issues, send commands to your device, monitor for specific patterns, and help debug communication problems. The built-in serial console lets you communicate with embedded devices directly from VS Code. Open it from the bottom panel or as a full editor tab with theembedder.openSerialInEditor command.
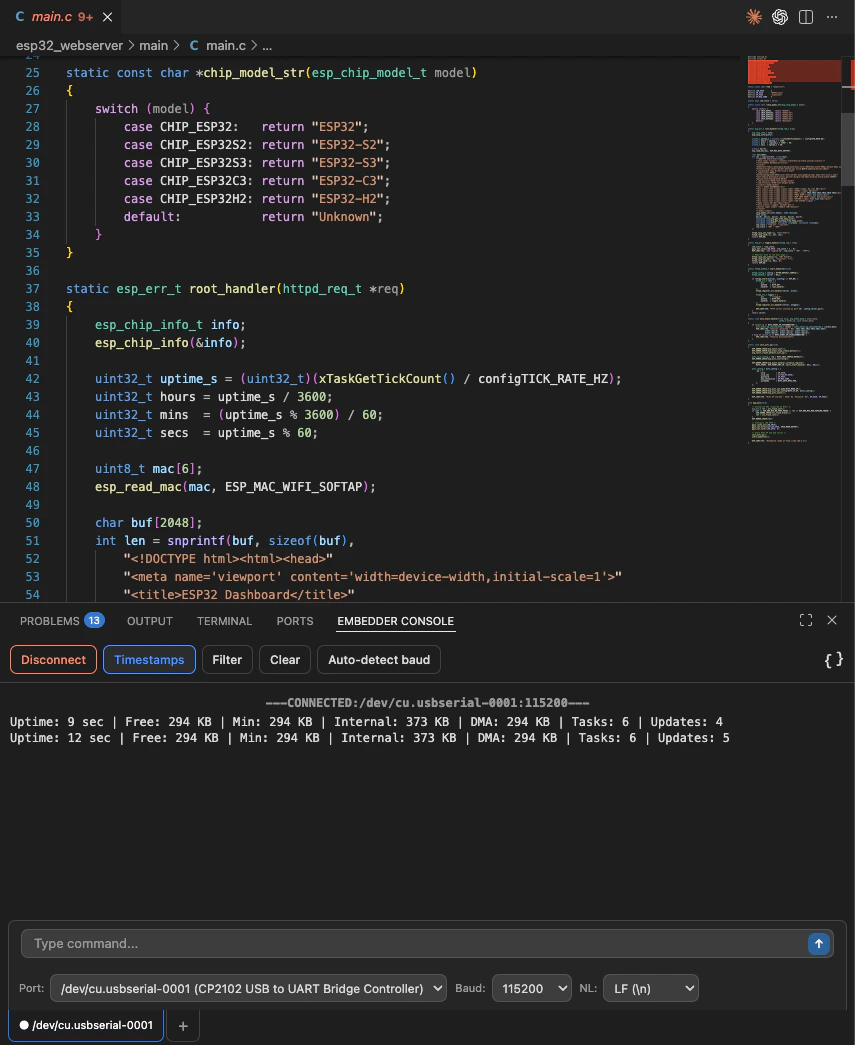
Port selection
Embedder auto-detects available serial ports and displays metadata like manufacturer, vendor/product ID, and serial number. Ports refresh automatically when devices are plugged in or unplugged.Baud rate
Select from common baud rates manually, or let Embedder auto-detect the correct baud rate. Auto-detection shows a confidence level so you know how reliable the result is.Multi-tab interface
Open multiple serial connections simultaneously. Each tab maintains its own port selection, baud rate, connection state, output history (up to 50,000 lines), filter pattern, and timestamp settings.Output features
- Log level coloring — Errors appear in red, warnings in yellow, info in green, and debug in blue.
- Timestamps — Optional timestamp prefix for each line.
- Regex filtering — Filter output with regular expressions.
- Clear output — Clear the console while preserving the connection.
Connection types
Embedder supports two connection types:| Type | Description |
|---|---|
| UART | Standard serial port connections (USB-to-UART adapters, dev boards) |
| RTT | SEGGER Real-Time Transfer via J-Link probes |
J-Link integration
Embedder automatically detects connected J-Link probes and supports RTT for non-intrusive debugging output. Select your target device from a picker with search and filter, with suggested devices based on your project context. Supports both SWD and JTAG interfaces.Next steps
Common workflows
Explore practical examples of what you can do with Embedder.
Best practices
Learn tips and techniques to get the most out of Embedder.